- Home
- Understanding aviation noise
- Improving impact management
- Understanding spatial variations
Dynamic population maps
Heathrow Case Study
After the first case study for Ljubljana airport, which was considered to be an airport with relatively low traffic, the next aim was to test the model on one of the largest airports in Europe surrounded by millions of inhabitants. Therefore, Heathrow airport was chosen for the second case study regarding dynamic noise maps. Due to its proximity to highly populated and dense areas, the airport has been engaging in noise management for many decades. Located 21km west of central London, the airport employs over 76,000 people - half of whom live in the surrounding five London Boroughs.
In 2019, Heathrow airport handled more than 80 million passengers and approximately 475,000 aircraft operations. The year 2019 has been selected for this case study based on the availability of data regarding population mobility patterns and air traffic. All the data regarding air traffic were obtained from Environmental Research and Consultancy Department (ERCD) of the Civil Aviation Authority (CAA).
Heathrow airport has two parallel runways. The Northern runway (direction 09L/27R) is 3,902 m long and 50 m wide, while Southern runway (direction 09R/27L) has length of 3,658 m with the same width of 50 m. The ratio of westerly (i.e. Runway 27L/27R) and easterly (i.e. Runway 09L/09R) operations is referred to as the runway modal split. During 2019, Heathrow recorded a 75/25 split in favour of westerly/easterly operations (Heathrow Airport, 2019). ANOMS is the Noise and Track Keeping system (NTK) at Heathrow, which receives radar data from NATS Air Traffic Control (ATC). Mean departure and arrival flight tracks were generated from summer radar data.
In order to obtain the human mobility patterns for population around Heathrow airport, London Travel Demand Survey (LTDS) data have been used for this case study. In 2018/2019, 18,575 people participated in the LTDS survey . There were 37,755 trips, taken by 12,995 persons. The other 5,580 survey participants (≈30%) reported that they stayed at home for the whole day. Weights provided in the LTDS were used to scale up the results and to give a rough estimate of the expected impact on the Greater London population (8,826,935).
In this research, Output Areas (OAs) are used as locations of usual residence. Output Area is the lowest geographical level at which census estimates are provided. Workplace Zones (WZs) represent usual places of work. They are an output geography for England and Wales that has been produced using workplace data from the 2011 Census. Data about population and workplace-based statistics were mostly provided by the Office for National Statistics (ONS) (https://www.ons.gov.uk/). Boundaries or Local Authority Districts and Population Weighted Centroids for OAs and WZs were obtained from The Open Geography portal from the Office for National Statistics (https://geoportal.statistics.gov.uk/). Detailed statistics about the characteristics of the workplace population was obtained from NOMIS website (https://www.nomisweb.co.uk/). Classification of Workplace Zones (COWZ) and cluster membership was used to assess the purpose of use for each workplace zone.
Since human mobility patterns were estimated from London Travel Demand Survey data, the population noise exposure analysis in this case study only included the residents of Greater London Area, while the affected population located west of the Heathrow Airport was not considered in this pilot research. Nevertheless, it has been shown that out of 1,121,096 persons living in 3,297 Output Areas for which the calculated noise levels are valid, 82.1% of them (920,505 persons living in 2,710 OAs) are located within the area for which the LTDS data are available, as shown in Figure 1.

Figure 1. Output Areas around Heathrow Airport and hourly LAeq noise contours (source: ONS, LTDS and ERCD UK CAA)
For this case study, the hourly LAeq noise contours (Figure 1) and noise levels for each location have been produced by the Environmental Research and Consultancy Department (ERCD) of the Civil Aviation Authority (CAA) based on the inputs provided by ANIMA research team. For that purpose, the UK aircraft noise contour model (ANCON 2.4) was used, which calculates the emissions and propagation of noise from arriving and departing air traffic according to ECAC.CEAC Doc 29 4th Edition Volume 2.
The average results of 1,000 iterations showed that a 10.9% increase in the number of people estimated to be highly annoyed by aircraft noise can be expected when daily movement of the population is considered, compared to the traditional approach of calculating noise exposure using only census data. This implies that people spend more time during the day in the areas most affected by aircraft noise, while there are less people in less affected areas around the airport. The absence of significant population movements during the night leads to a minor difference (-0.2%) in the number of people estimated to be highly sleep-disturbed by aircraft noise between the two approaches. Although this decrease suggests that during the night people tend to spend more time outside the areas affected by aircraft noise, such difference is negligible.
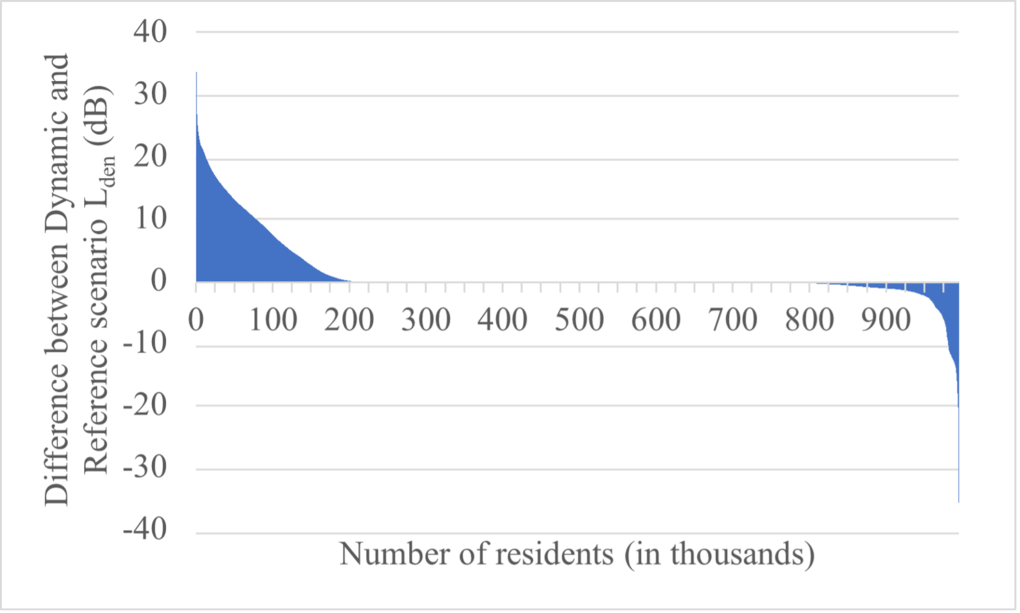
To assess how population movement patterns influence the changes in noise exposure on an individual level, detailed analysis conducted for Lden and Lnight noise indicators showed that for some people these differences in noise exposure were much more pronounced. In the case of Lden (Figure 2), this noise impact during the whole day can be underestimated by up to 33.9 dB or overestimated by up to 35.4 dB, and the similar situation was observed for Lnight indicator.

Figure 2. Lden difference between Dynamic and Reference scenario
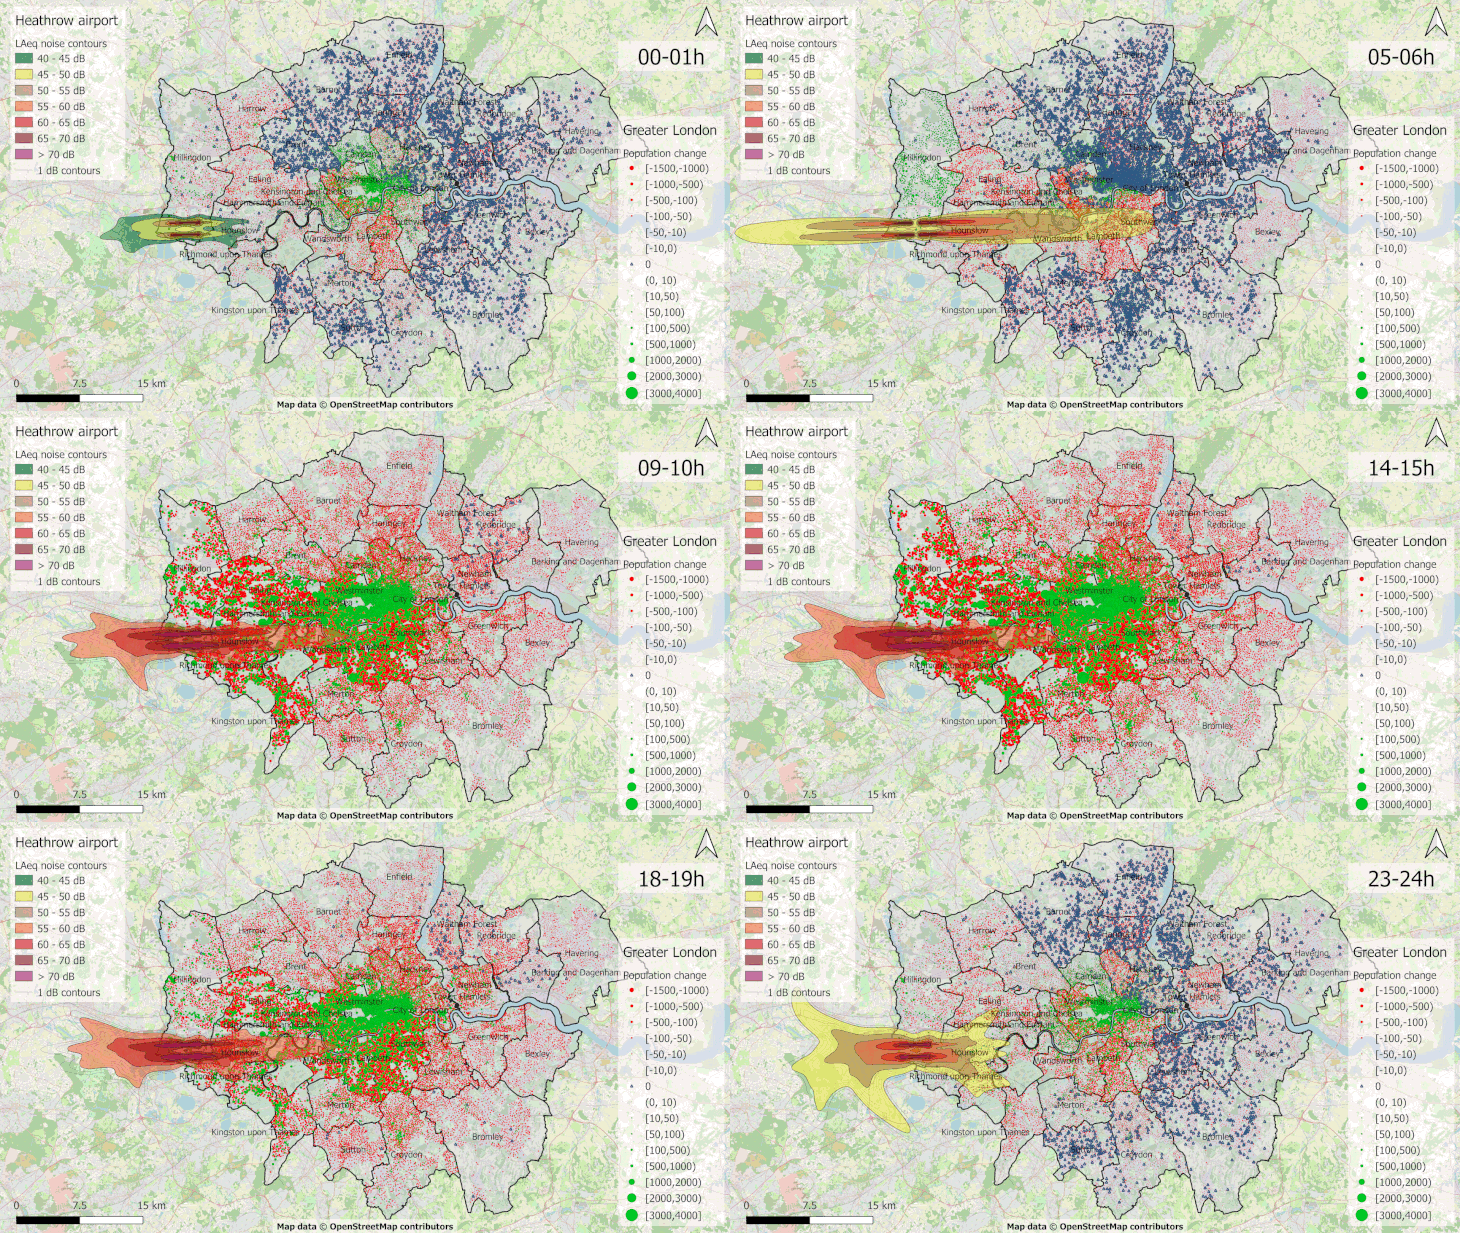
To better demonstrate the dynamics behind this novel approach, the 24 different hourly noise maps, including the estimated population change at each location, are combined and presented in the video below (Figure 3). This video illustrates the temporal and spatial variation in population around Heathrow airport. In addition, the change in the number of operations between each hour is clearly visible through the different shapes and areas that calculated noise contours take. As expected, the most minor changes are observed during night hours, when the traffic frequency is low as well as the movements of the people.
 Figure 3. Simulation of dynamic noise maps for Heathrow airport
When comparing the noise exposure of people travelling in and out of the aircraft noise affected areas, the main conclusion is that many of them experience noise levels different from that expected at their residential locations. This suggests that a more accurate noise mapping approach needs to include the consideration of daily mobility patterns when assessing population noise exposure.
Relevant information
Dynamic Noise Maps for Ljubljana Airport – 10th SESAR Innovation Days, 2020.
Authors: E. Ganić, N. van Oosten, L. Meliveo, S. Jeram, T. Louf, J. J. Ramasco.
Presentation: Emir Ganic - ANIMA Dynamic Noise Maps
New perspectives on spatial and temporal aspects of aircraft noise: Dynamic noise maps for Heathrow airport
Emir Gani´c, Fiona Raje, Nico van Oosten
To cite the paper, please use this link: https://doi.org/10.1016/j.jtrangeo.2022.103527


