A so-called Public Toolset is available for the general public. The Public Toolset has been developed for a “virtual airport” to illustrate the basic concepts of airport noise mapping. To this end, a set of traffic scenarios has been included, which the user can visualise and for which relevant information on the essential components (aircraft operations, tracks, noise contours, populated areas, etc.) can be displayed.
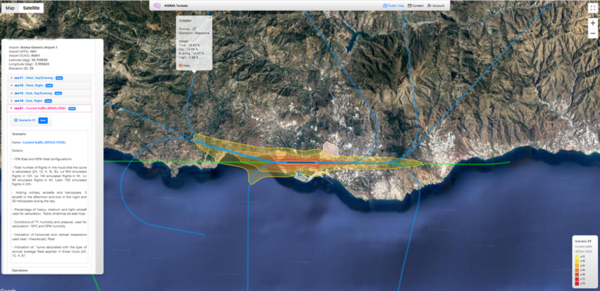
Figure 1. Example of a scenario included in the public version of the Noise Management Toolset
Apart from the Public Toolset, limited to the illustration of basic concepts, a premium version (the Noise Management Toolset) has been developed. It addresses users' needs such as land-use planners, policymakers, airport staff, universities, etc. These users will want to generate their own scenarios at an actual airport, e.g., designing an intervention and assessing its effect on noise exposure and impact. Registration is required to obtain access to this advanced version of the NMT.
As the first step, an authorised person (here called the Airport Owner) shall request the inclusion of an airport in the NMT database, following the procedure described on the NMT website. This person shall have the permissions required to publish the information relevant to the noise calculations at that airport. The Airport Owner shall provide a dataset with which the NMT Administrator can generate the single event database and configure the system to include the new airport. This dataset will include information on the runway(s), standard flight routes (tracks), aircraft fleet, populated areas, etc. Once this database is ready, the airport will be available in the NMT, and the Airport Owner can invite additional users to register for the new airport. Each NMT user will have access to all functionalities of the NMT for the virtual airport and the airport(s) they have been assigned to.
Building of scenarios
The basic structure for the calculations conducted with the NMT is called a scenario. A scenario represents a specific noise situation at an airport and consists of a specific combination of the single events available in the database. Every single event is defined by a unique combination of:
- Aircraft type;
- Type of operation: arrival or departure;
- Vertical flight procedure („Profile“);
- Distance flown (indicator for the weight at take-off);
- Runway;
- Track.
To define a scenario, the user should provide the following information for every single event (Figure 2):
- Number of operations;
- Time of these operations – exact local time or period (day, evening, night).
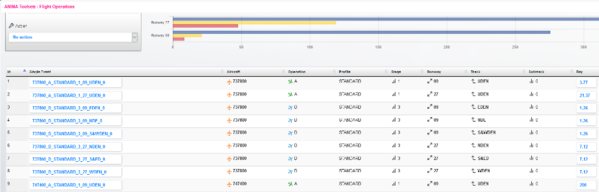
Figure 2. Example of building a scenario, based on single events
The NMT provides several options to create a new scenario. As the first option, a scenario can be generated from scratch. In this case, the user has to provide all the information on the aircraft operations. It can be done by manually filling in a table like the one presented in Figure 2, or, more conveniently, by uploading a file containing the airport flight plan (similar to the timetable usually managed at airports, i.e. providing the time of each operation) or a so-called operations file (resembling the table shown in Figure 2, grouping the operations by the period of the day, thus losing the time information of the individual operations). Templates for both are available on the NMT website.
Usually, the user will need to create the first scenario for an airport in one of these ways. However, once this is done, it is generally more convenient to clone the existing scenario and then change only those operations required to define a new scenario. Several innovative features are available to assist the user in determining a new scenario. It is possible to move a certain number of operations from one track to another for all aircraft and periods or for specific aircraft types and/or time periods individually. Similarly, it is possible to increase the number of operations by a certain percentage to simulate traffic growth easily.
Once a scenario has been created by one of the procedures explained above, the noise calculation is invoked, generating noise exposure and impact maps.
Visualisation of results
Once a scenario has been calculated, the results can be visualised. The user can select the noise/impact contours that should be shown on the map. Information on track usage, specific populated areas and other data can also be presented (Figure 3).
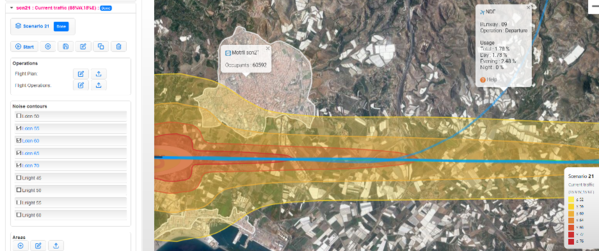
Figure 3. Visualisation of the results of a scenario and other relevant information
To assess the effect of the intervention represented by a scenario, the results (noise exposure and impact contours) of that scenario can be compared with those from another scenario. A maximum of four scenarios can be compared at the same time. Figure 4 gives an illustration of a comparison between two scenarios, each representing a specific runway usage.
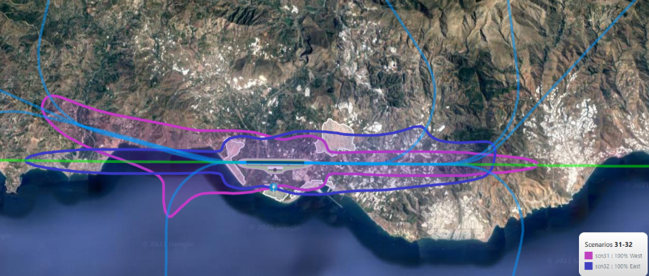
Figure 4. Comparison between two scenarios (runway configurations “100% East” vs “100% West”)