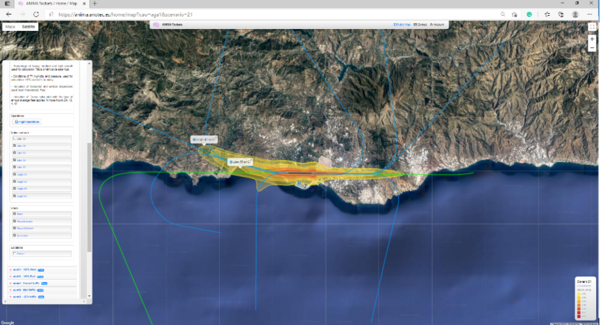
The features of the reference scenario 2.1 are as follows:
Airport – the virtual airport has one runway (09-27), one platform and one taxiway.
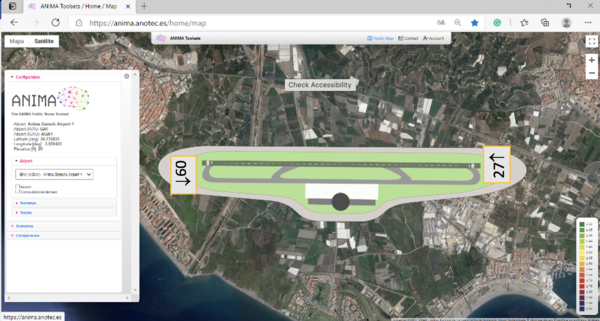
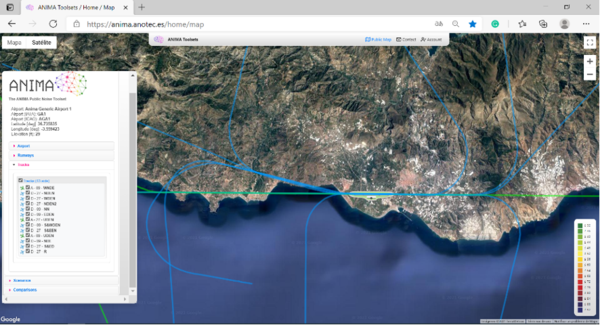
Routes – the tool presents the runway tracks under the contours. Tracks in green are for landing, and tracks in blue are for departing. In the virtual airport, all the tracks starting with 09 are directed to the East (departures and arrivals) and are used when the wind is blowing from the East. All the tracks starting with 27 are directed to the West and used when the wind blows from the West.
Aircraft – in the virtual airport, aircraft are organised by family types and presented by ICAO/IATA codes: A20N; A21N; A306; A319; A320; A321; A332; A333; A339; A343; A359; A388; AT72; B738; B748; B74Y; B75F; B762; B772; B773; B77W; B788; B789; DH8D; E135; FALC; GLEX; MD11. The toolset presents statistics by aircraft categories, which are visible in the “flight operations” window:
- MR = Medium-Range aircraft (regional jets, A320, B737, etc.);
- LR2 = Long-Range aircraft with two engines (A330, A350, B777, B787, etc.);
- LR4 = Long-Range aircraft with 4 engines (A340, A380, etc.);
- TP = Turbo_pro aircraft (ATR, Dash-8, etc.);
- Other = other aircraft types not mentioned above (general aviation, helicopters, etc.)
Procedures – for simplification and because the ground noise in most cases is not significant, ground procedures are not considered in the ANIMA virtual airport.
For air procedures, the wind has a significant impact on different airport operations. The main runway of the airport must face the prevailing wind in the area to avoid crosswind. Commonly, at most international airports, if the landing operations have 20kts of crosswind or 10kts of tailwind, it is recommended to stop landing operations or change them to another runway or direction. Usually, this alternative configuration involves switching the roles of the runways – the ones used for take-offs are used for landings and vice versa (to have the wind in front instead of in the back). Therefore, usually all airports have at least two normal configurations – one preferred and one non-preferred.
Normal operations at the ANIMA virtual airport present:
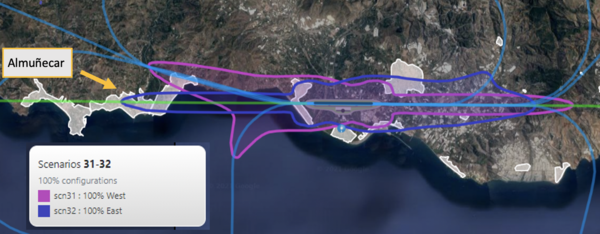
- The preferred configuration – West Configuration. It is used when the aircraft will take off and land facing the West because the wind comes mainly from West (85% of the time of the year, according to the data of the year simulated – longest series of wind data available can be used in forecast scenarios);
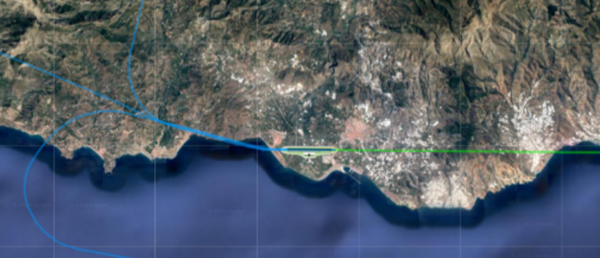
Flight procedures – green for landing and blue for take-off – used when the winds come from the West. The same procedures are used in the daytime, evening and night periods. It is displayed in Public Toolset scenarios 1.1 and 1.2.
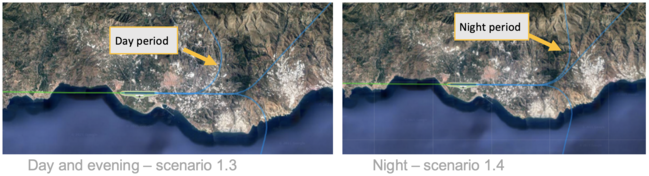
- An alternative configuration can be used when the direction of the wind changes and comes mainly from the East (15% time of the year), therefore, the aircraft will take off and land facing the East. The non-preferred configuration – East Configuration – is which the aircraft use tracks that are not as common but well-known and normal. Moreover, it is important to note that because of where the populated areas are located, there is one track (closer to the populated areas) that can be used during the day but not during the night;
Normally, tracks are called by the name of the first navigation point to which they are headed. In the case of the virtual airport, the following naming convention is used instead:
- D = departures or A = Arrivals;
- 09 or 27 (starting head of the runway);
- First letters to define the direction (aircrafts heading to the North – N, to the West – W, to the South – S, to the East – E, and Unique when there is only one – U);
- Letters in the end describe day periods (day – D, evening – E and night – N).
Traffic – the current traffic of the airport is 232,015 flights per year, 72% of which take place during the day (7 AM - 7 PM), 20% of which take place during the evening period (7 PM – 11 PM) and 8% are during night period (11 PM – 7 AM).
Weighting – to simulate more than 200,000 movements, it would be necessary to have supercomputers. Standard computers can only simulate one day traffic. The methodology defines the “typical day” in one year to gather the information of one year in one day. The “typical day” is a “virtual day” built with different annual weightings.
For calculating these weightings, firstly, it is necessary to know the number of flights simulated. In the case of the virtual airport, this number is 700 flights – an average day in the maximum month (highest traffic month) of the year. The rest of the conditions of the “typical day” are developed using four different weightings:
- Annual configuration weighting;
- Traffic weighting per period of the day;
- The weighting of the aircraft family type;
- The usage of each track.
Firstly, annual configuration weightings – 85% of the traffic will be simulated running through the West procedures, and 15% will be simulated running through the East procedures.
Secondly, traffic weightings per period – 72% of the traffic will be simulated for the daytime, 20 % for the evening and 8 % for the night-time. For example, by applying both, the simulation will have 504 flights during the day (72%), of which 428 will run to the West and 76 to the East. It will also have 104 during the evening (88 to the West and 16 to the East).
According to the annual statistics of aircraft kinds flying in the airport, the third weighting is the aircraft family typeper period of the day and per configuration. Each scenario's button “Flight operation” presents the numbers applied to the “typical day”.
The fourth and last weighting to apply is the use of each track, which depends mainly on the direction of the aircraft's final destination. In the ANIMA virtual airport, tracks are heading to the North, South, East and West and some of them are split into two – they depend on the period of the day, which means that sometimes the track heading to the North during the day is not the one used during the night period, usually for avoiding noise issues. The data is derived from annual statistics.
Therefore, the “typical day” will have 700 flights distributed over different tracks, configurations, periods of the day and aircraft family types. According to the annual weight, it is possible to find 0,2 flights of one specific aircraft family (for example, one heavy aircraft family flying 20 times in one year) in a particular track (because the annual data is used when the weight is calculated for one “typical day”).
If the user wants to simulate one normal day instead of one typical day, a real number of flights per configuration/period of the day/aircraft family/tracks can be used instead of the annual weight. Because of the END methodology, it is worth noting that the toolset will simulate just one day while using one full year's weight (thus representing that full year).
Dispersions – the toolset uses real profiles (both horizontal and vertical) for single events, so more dispersions are not needed.
Geophysical conditions and population –the Public Toolset present a map under the noise contours in a picture format to simplify and allow quick virtual calculations. Therefore, the toolset does not present calculated surface measurements or the calculated number of people affected by any changes to the scenario. The toolset presents just a visual overview in a particular virtual case, and the contours of urban areas can be selected to appear under different footprints.
Meteorology – all scenarios have been calculated using the same weather conditions, which are: temperature of 25ºC and humidity of 70%. The premium version of the tool allows other weather conditions.
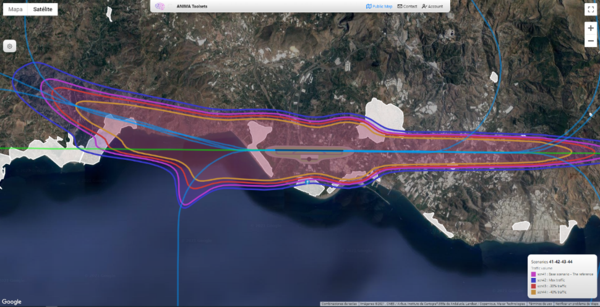
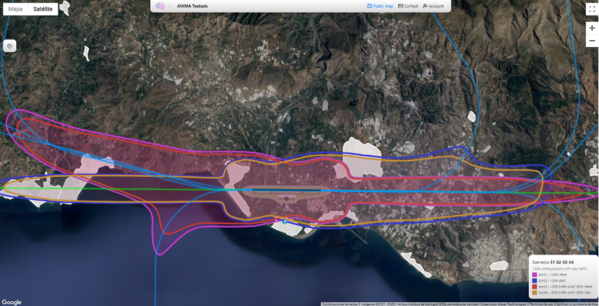
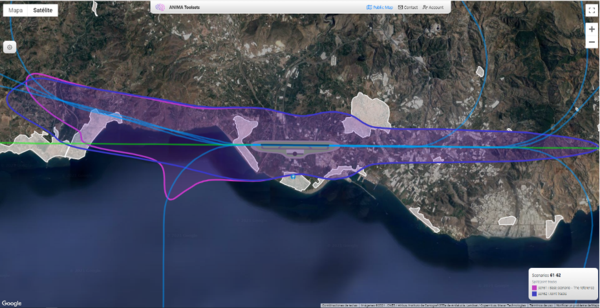
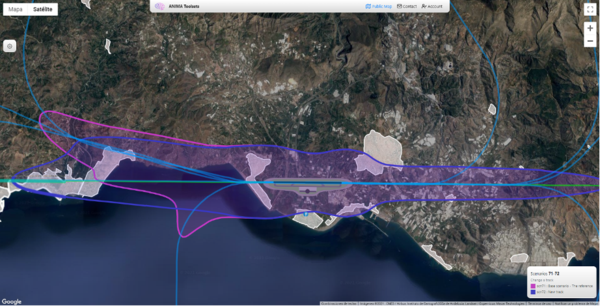
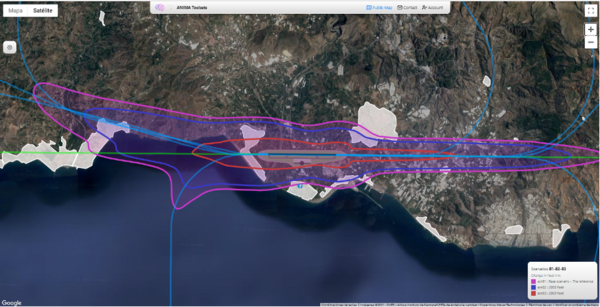
Following the Environmental Noise Directive methodology and the data mentioned above, the toolset will generate noise contours and present the results in Lden and Lnight indicators. For purposes beyond the END, other metrics like Lday16h and LAmax are also available.
The legend will show the aforementioned main data used for the calculations. Moreover, by clicking on each contour, the user will see an indication about the indicator and noise level or the track used with their weightings. The user will be able to choose the levels and indicators shown, the urban areas, and use the scenario compared to other scenarios.